Search “freight planning tool,” and every result is written for someone buying freight. Procurement checklists for shippers. Supply chain strategy kits for logistics directors. Capacity sourcing templates for a transportation planner at a regional agency. None of it describes what a dispatcher at a 75-truck fleet needs when three loads hit the board in the same ten-minute window, and each change determines where a driver ends up tomorrow.
The gap matters because carrier margins in 2026 come from operational discipline. Empty miles averaged 16.7% of total miles driven in 2024. That number is the direct result of load selection, driver matching, and backhaul sourcing happening in disconnected workflows, one decision at a time.
Any dispatcher who has scaled a fleet knows the other half of this. The whiteboard works fine at 20 trucks. Somewhere between 40 and 50, it stops, and no amount of working harder fixes it. That ceiling is structural. This guide covers what freight planning tools mean from the dispatcher’s chair, and why tools that handle all three decisions in one place are a different category from those that handle only one.
Key Takeaways
- Freight planning means something different depending on which side of the transaction you’re on. For carriers, it comes down to three compounding decisions: which loads to accept, which drivers to assign, and how to fill the return leg.
- Empty miles averaged 16.7% of total miles driven in 2024 (ATRI). For a 100-truck fleet running 2,500 miles per truck per week, that’s roughly 42,000 unproductive miles per week at $2.26 per mile in operating costs.
- Manual load-matching runs 20 to 30 minutes per assignment. One dispatcher hits a structural ceiling around 40 to 42 active trucks because the workflow doesn’t scale.
- Most tools solve one of the three decisions. The ones that handle all three on a single platform are materially different products.
- The TMS market is projected to reach $37 billion by 2030 (MarketsandMarkets). Carriers closing the margin gap in 2026 are doing it through operational efficiency.
What does “freight planning tool” mean if you’re a carrier?
A shipper and a carrier mean two different things by the same term. For a shipper, freight planning tools are procurement instruments: capacity-sourcing frameworks, supply chain strategy kits, and carrier scorecards. For a carrier, freight planning is operational: deciding which loads to accept, which drivers to assign, and how to fill the return leg. If you landed here looking for shipper-side procurement resources, this isn’t the guide for you.
Carrier freight planning happens dozens of times a day at scale. Every decision runs on live data that changes from the moment a load is posted to the moment a driver is assigned, and each one from the moment a load is posted to the moment a driver is assigned, and each one has downstream consequences for where the truck ends up and what it can do next.
This guide is scoped for dispatchers and operations managers at trucking carriers operating medium- or enterprise-sized fleets. That’s the point where the volume of coordination starts to outrun what manual workflows can carry.
Why manual freight planning hits a ceiling around 40 trucks
Start with the math on a single assignment. To match one load, a dispatcher checks who has hours, where the driver is, what equipment they’re on, whether the rate covers the deadhead, and whether there’s a viable return leg. Done manually, that runs 20 to 30 minutes per load. Across eight hours of dispatch time, that’s 16 to 24 assignments a day. Put 40 trucks on that dispatcher, each running multiple loads a week, and the day runs out before the loads do.
The ceiling is built into the workflow, and headcount doesn’t move it. Hiring another dispatcher helps for a while, then introduces its own drag: coordination overhead between desks, institutional knowledge that lives in one person’s head, handoffs that drop. The constraint was always the workflow. Any dispatcher who has been through a growth phase recognizes this, because hiring didn’t fix it.
The three carrier-side decisions that compound every dispatch cycle
Decision 1: Load selection by actual profitability. A $2.50/mile load that drops the truck 300 miles from the next paying freight is worth less than a $2.10/mile load with a solid return leg. Without a tool that factors in deadhead cost, detention risk, and lane history, dispatchers default to the highest posted rate. That’s consistently the wrong call. Rate-first selection routinely strands trucks on empty outbound legs, and those empty legs are exactly what compounds into ATRI’s 16.7% average.
Decision 2: Driver matching against real-time HOS and position. The dispatcher needs to see who has hours, where they actually are, and what they’re pulling, all in one view, before committing to a tender. Manual workflows scatter that across ELD lookups, phone calls, and status checks that are always one refresh behind. Assign the wrong driver and you’ve added deadhead before the load even starts, while the truck that could have run it is now stuck on something less profitable.
Decision 3: Backhaul sourcing during the outbound run. The window to book a profitable return closes while the truck is still rolling. By the time the driver delivers and the dispatcher opens a load board, carriers with automated outreach have already claimed the good options. This is the real mechanism behind the 16.7%-20% empty-mile range: backhauls exist, but the sourcing window closes before a manual search can reach them.
These three don’t sit side by side. They compound. A dispatcher running all three sequentially loses time at every handoff. A tool that nails load selection but skips driver matching hands you the right load on the wrong driver. A tool that handles dispatch but ignores backhaul recovers margin on the outbound leg and gives it back on the return. That’s why carriers who bolt a single-purpose tool onto one decision rarely see proportional gains. The friction just migrates to the next handoff.
Run the numbers on a 100-truck fleet at 2,500 miles per truck per week. At 16.7% empty miles and $2.26 per mile in operating costs, that’s roughly 41,750 unproductive miles a week, about $94,000 in costs with zero revenue. Annualized, that’s a number you fix at the workflow level or keep paying.
What separates a freight planning tool from a dispatch add-on
Most tools on the market address one decision. Load boards surface available freight, but don’t rank it by net margin. ELD platforms show HOS data but don’t recommend driver assignments. Standalone backhaul tools don’t talk to the dispatch board. A dispatcher juggling three separate tools still manages the handoffs by hand, which reintroduces the exact time constraint the tools were supposed to remove.
| Decision | Single-purpose tool | Integrated platform |
|---|---|---|
| Load selection | Ranks by posted rate or lane; no margin calculation | Ranks by net profitability after deadhead, detention risk, and lane history |
| Driver matching | Requires separate ELD lookup and dispatcher check | Surfaces available, drivers with HOS, location, and equipment in one view |
| Backhaul sourcing | Manual load board search after delivery | Automated outreach to shippers during the outbound run |
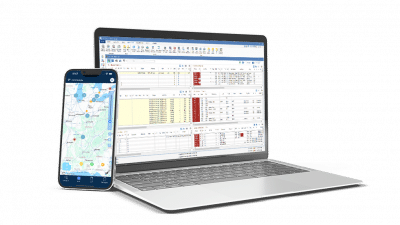
PCS TMS handles all three carrier-side freight planning decisions on a single platform: dispatch, driver matching, and backhaul sourcing, without switching tabs.
How PCS TMS and Cortex AI handle all three decisions
PCS’s Load Opportunity Manager captures and ranks freight from broker emails, EDI feeds, and load boards by profitability. It uses natural language search and custom ranking rules, so dispatchers stop chasing the highest number and start selecting loads that fit the lane, the equipment, and the return leg.
PCS’s Dispatch Manager, powered by Cortex AI, matches drivers against 36 real-time data points including HOS, location, equipment, and lane history. Tender-to-dispatch time drops from 20-30 minutes to under a minute with one-click assignment. That’s the driver-matching decision handled at speed.
PCS’s Backhaul Booster initiates automated outreach to shippers while the outbound truck is still running. It contacts shippers via branded email or AI voice call before the truck stops, closing the gap between available return capacity and the dispatcher’s manual search window.
Fit matters, so the honest line is that this platform is built for carriers operating 25 or more trucks. Below that, the ceiling described earlier may not be something you feel yet.
What the TMS market signals about carrier freight planning in 2026
Market growth points to a structural shift. The global TMS market was around $18.5 billion in 2025 and is projected to reach $37 billion by 2030, growing at 14.9% CAGR (MarketsandMarkets). Cloud-native, AI-embedded platforms are driving that growth, and mid-market carriers are a big part of it.
AI in trucking is delivering in narrow, specific workflows. Logistics Viewpoints’ 2025 TMS review found AI performed strongest in load matching and asset utilization, framing it as “decision support, not autonomy.” The practical read is that the value comes from cutting time per decision.
PCS has been building carrier freight-planning software since 1996, and Cortex AI is embedded in the same platform that dispatchers already use. The 25-plus years of freight operations data behind Cortex is what the decision support runs on.
How to evaluate a freight planning tool if you’re a carrier
- Does it handle all three planning decisions natively? This is the one question that matters most. Ask the vendor directly: Is load profitability ranking built in or farmed out to a separate tool? Is driver matching pulling live ELD data or relying on a manual check? Is backhaul sourcing automated or still dispatcher-initiated? Any answer that starts with “integration with a partner tool” means you’re counting handoff time.
- Does it connect to your existing ELD and fuel card systems? A planning tool that can’t pull real-time HOS from your ELD sends you back to manual status checks, which rebuilds the ceiling you were trying to remove. PCS TMS connects with 70+ integration partners across ELD providers, fuel cards, and load boards, putting HOS data, fuel costs, and available freight in one place.
- Does it scale without a platform switch? Carriers who outgrow a tool mid-growth pay twice: once for implementation, once for migration. PCS TMS serves carriers from 25 trucks to 1,000-plus on the same platform at both ends of that range.
- Is implementation measured in days or months? Dispatchers learn PCS in days. Ask any vendor for reference customers who can speak to actual ramp time.
Freight planning and the 2026 margin environment
Spot rates have moved above contract rates for the first time since 2021, according to Ryder’s 2026 freight market outlook. That’s the first real rate tailwind mid-market carriers have seen in years. The carriers set up to catch it are the ones who already have load-selection discipline and automated backhaul sourcing in place, ahead of those scrambling to book loads by hand when volume returns.
The carriers improving their margins in 2026 are doing it through operational efficiency. ATRI puts the total marginal cost at $2.26 per mile. With rates recovering, the gap between carriers who can act on freight fast and those who can’t shows up directly in revenue per load.
PCS TMS helps medium and enterprise fleets close the empty-mile gap through integrated load selection, driver matching, and backhaul sourcing, all in one platform.
Frequently asked questions about freight planning tools for carriers
For trucking carriers, a freight planning tool handles the three compounding decisions at the core of dispatch: which loads to accept based on actual profitability, which drivers to assign based on real-time HOS and location, and how to source profitable return loads before the truck delivers. Shipper-side planning tools, such as procurement checklists and capacity templates, are a separate category designed for a different buyer.
Load boards surface available freight. A freight planning tool ranks that freight by net margin, matches a driver to it, and starts outreach for the return leg before the dispatcher picks up the phone. A load board is one input into freight planning.
The structural ceiling for manual dispatch is around 40 to 42 active trucks. PCS TMS is designed for carriers running 25 trucks or more, the point at which load volume starts to outpace what manual coordination can handle without adding headcount at the same rate.
No. PCS’s Cortex AI is decision support. It surfaces the right load, the right driver, and the right backhaul, and the dispatcher confirms with one click. The dispatcher’s job shifts from gathering data to managing exceptions.
The bottom line on freight planning tools for carriers
Carrier-side freight planning is three decisions that compound across every dispatch cycle, and the tools worth buying handle all three in one place. PCS TMS with Cortex AI ranks loads by net profitability, matches drivers against 36 real-time data points, and sources backhauls during the outbound run, in a single platform.
PCS has been building carrier software since 1996, and Cortex is embedded in that same system rather than bolted onto it. It connects with 70+ integrations across ELDs, fuel cards, and load boards, so it works with the systems you already run.
Ready to see how it works? Schedule a demo with a PCS TMS specialist.
Related Guide